I recently started playing with Grafana as a dashboard to keep an eye on my local network of IOT devices, and it’s turned out to be very useful on more than one occasion so far.
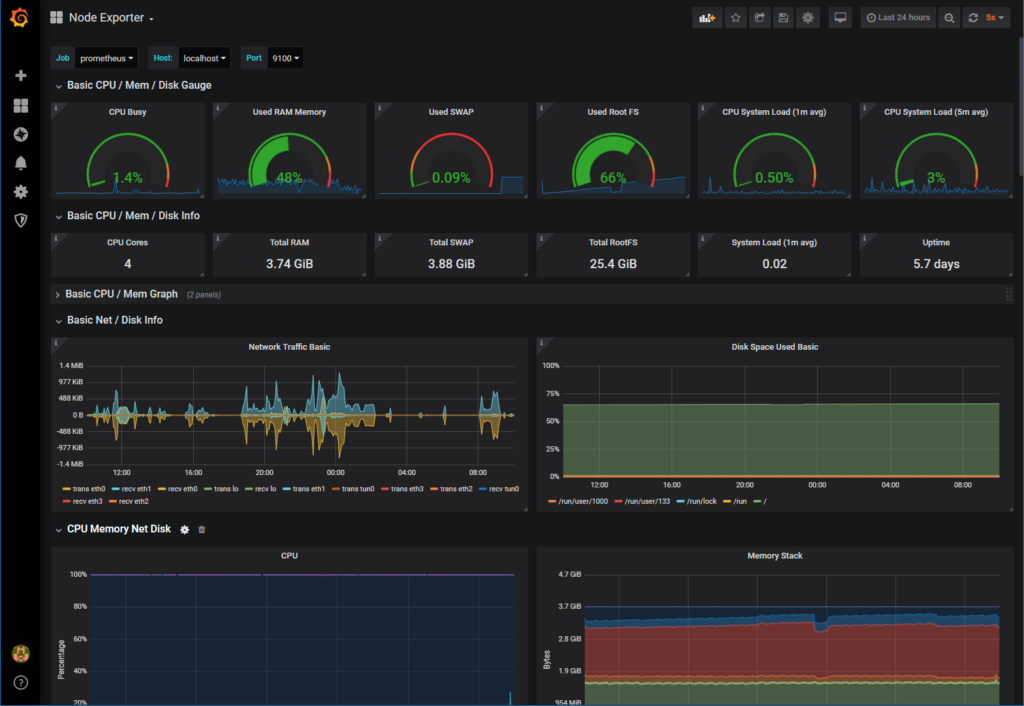
I wanted to monitor some devices on my network, and I’d been playing with Grafana, so I looked around for a back-end that would be suitable. I had been using EmonCMS to record most of my IOT device data, but Prometheus seemed to be the new kid on the block, and I wanted to learn something new (as always). So I downloaded Prometheus, added a source to my Grafana dashboard, installed node_exporter for detailed information on my local machine, along with a pre-canned node_exporter dashboard, and low an behold, details statistics started flooding in.
Next step was to look around for an exporter that was designed for real-time monitoring of hosts on a network. I eventually came across blackbox_exporter. It pings hosts at intervals and returns some statistics about the responses. The most interesting to me was whether the host was up or down.
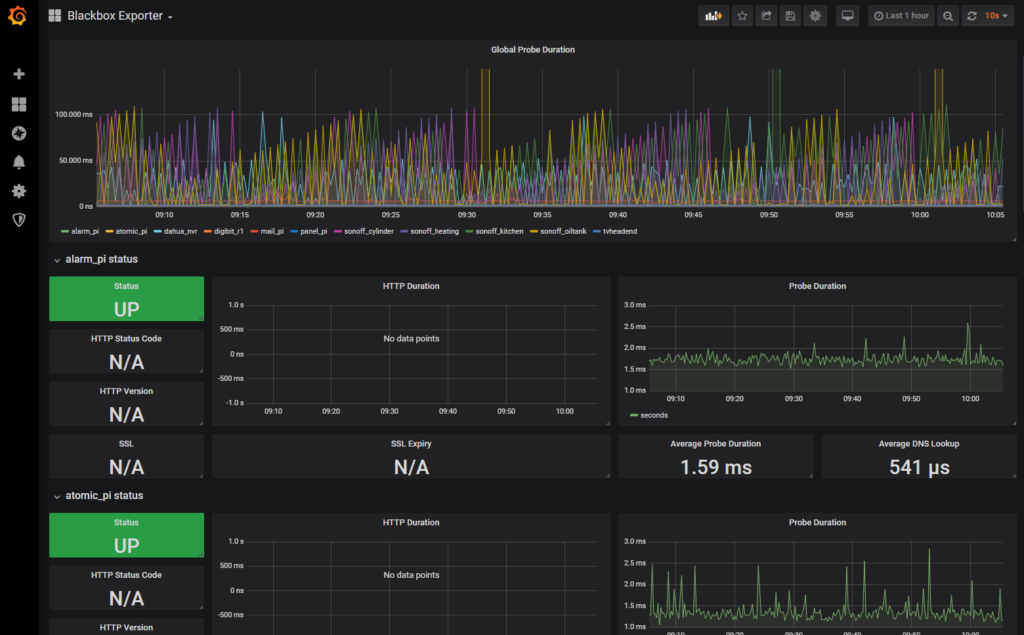
Now while this was a good start, the pre-canned dashboard for the blackbox_exporter required a lot of scrolling to see the status of all the hosts, so I started building a custom dashboard for my own specific purposes. I also have firewall rules that records the throughput of each host on the network, so I decided to also put that on my dashboard.
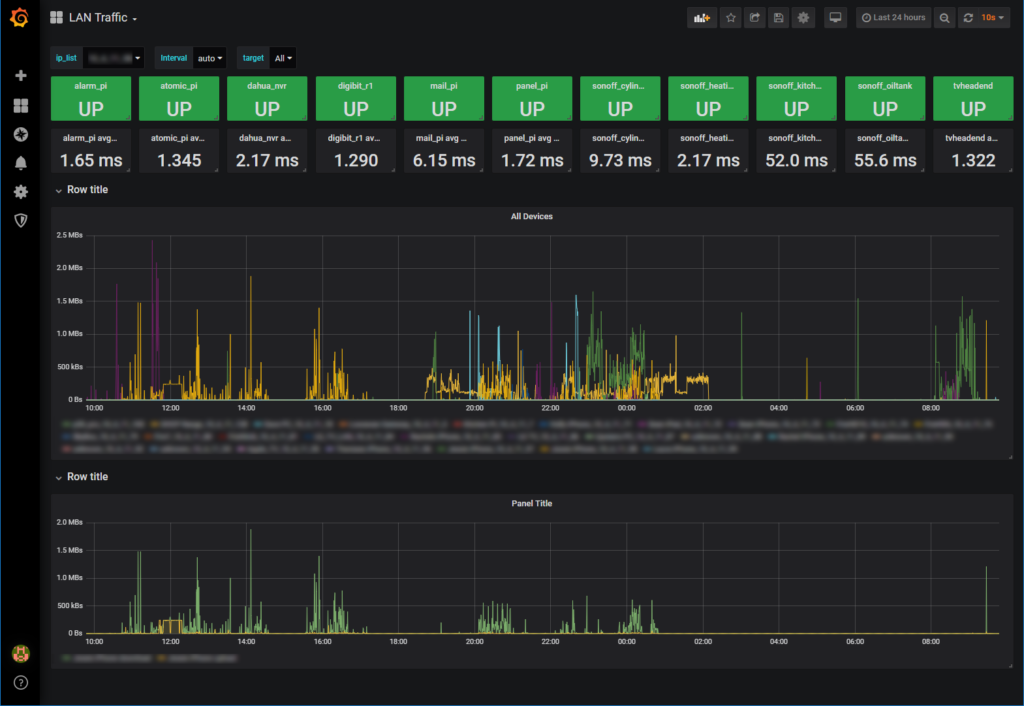
I even have a bookmark on my 4K smart TV web browser that shows this dashboard, and it looks great!
The interesting part of this is the row of green boxes along the top, showing whether the most recent ping to the hosts were successful. If any host is down, it will be shown in red.
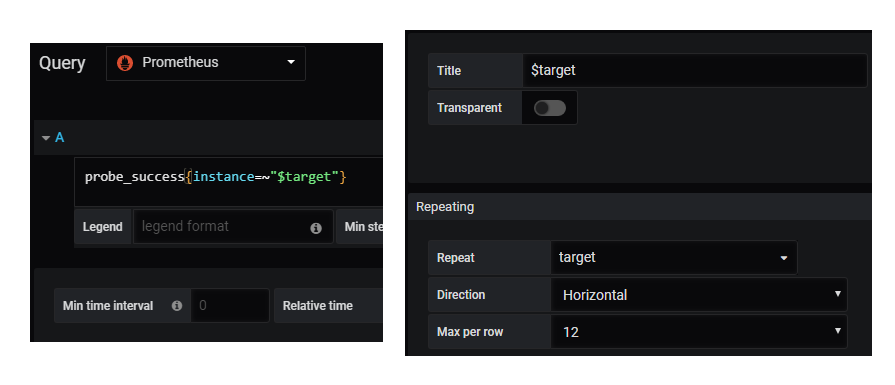
By adding a singlestat widget, and applying the probe_success metric based on the $target variable which was a list of all the monitored hosts, I was able to then set the repeat attribute, and it automatically renders a widget for each monitored host. Very compact indeed!
Interestingly, I had recently got an Atomic Pi single board computer (Intel Atom based board for $35, I imported 2 from the US (they cost me about $180 in total for the $95 devkit with 2 boards because of shipping and taxes), and I noticed that it was showing as red on the dashboard. I noticed this about 6 hours after it went down because of the historical data in the blackbox_exporter dashboard. I tried rebooting it, but it seemed dead, swapped in the second board, also would not boot. Turns out the supplied Power Supply with the devkit had died, and once I replaced with another 5V supply, it was back showing green on my custom Grafana dashboard!
Another interesting observation was one of my critical hosts was returning very large pings at quite regular intervals, sometimes even showing up as red on the dashboard. On digging a bit deeper into what was running on that machine, it turned out that it was an old watchdog script that bounced the network interface if it couldn’t ping a particular host, and the host it was attempting to ping had been removed from the network several months ago. So changing the host to my gateway host solved the problem, pings went back to normal, and that host has been showing green ever since.
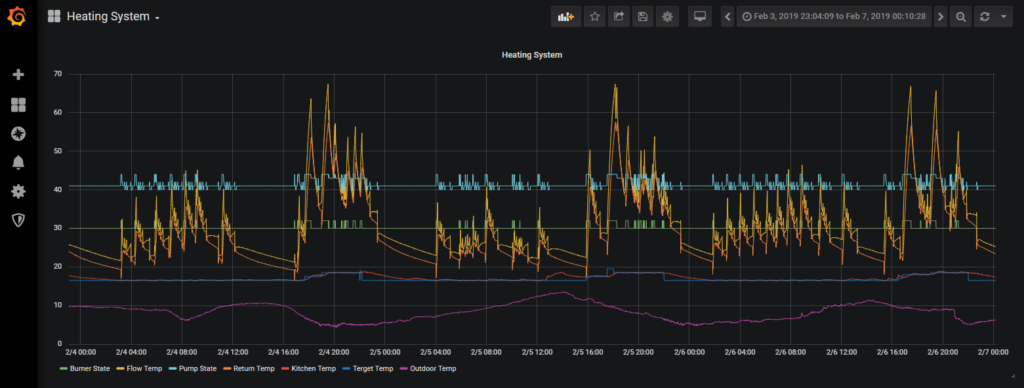
I’ve since added a lot of the charts I previously had in EmonCMS, such as my heating system info:
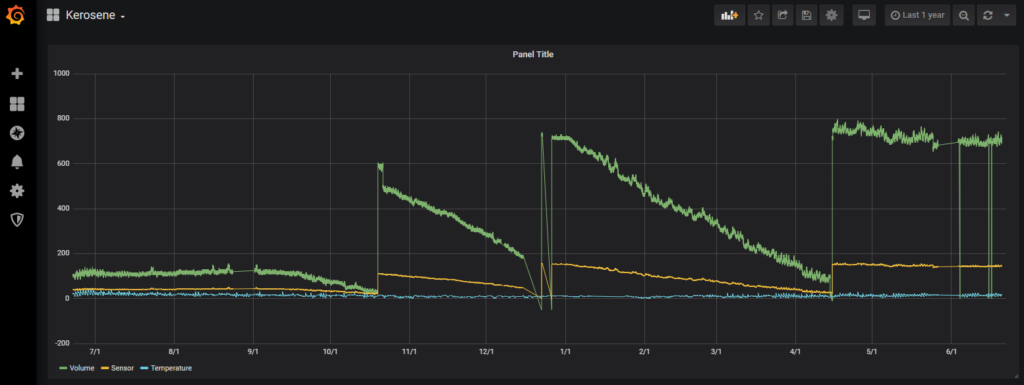
My Home Heating Oil tank level (showing oil use over several months):
And the readings from my outdoor air quality sensor:
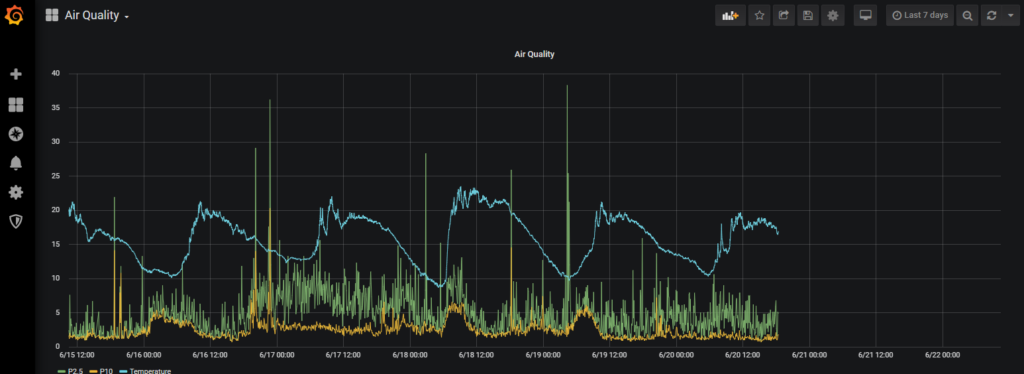
You can see from this particular chart that it’s stopped reporting since a couple of days ago. The host that’s generating that data is not on the list of hosts on my dashboard, so I guess I’ll have to add it in!